Formby Tide Poles
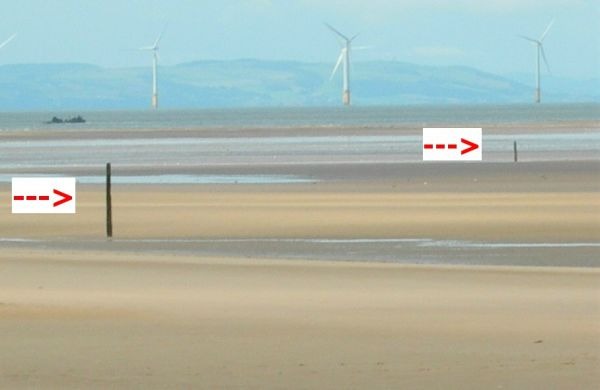
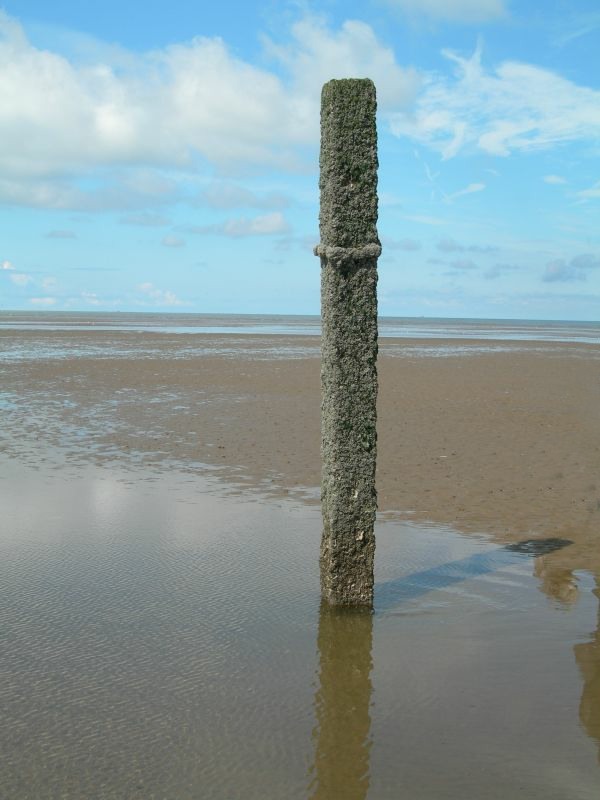
If you stand on the site of the Formby Lifeboat Station and look out to sea at low tide, two tall posts can be seen. These have been there for many years playing an important part in the recording of tides so essential for the safety of shipping into the Mersey.
As early as 1764 the Dock Master of Liverpool, William Hutchinson was meticulously recording the tides and his recordings enabled Richard and George Holden to calculate expected times and heights of tides and publish a yearly tide table. Hutchinson continued his observation and the Holden’s in their 1773 tide table preface, congratulate themselves that “their calculations have agreed with the observations within seven inches and within five minutes’.
Over the years the Mersey Docks and Harbour Board have continued to record actual tide heights on the dock sills and at various place in Liverpool Bay and compare them with predictions. At first this was done by visual readings but is now done automatically. The tide poles at Formby were last used officially in the 1970’s.
In 1889 the keeper of the tide gauge, who was also the Lifeboat Coxswain, was paid an allowance of 3/6 per day “to keep the tide gauge when ever it is required. In the 1970’s the gauge was read daily every 15 minutes from 9am to 4pm. The readings were entered on a large sheet and sent to the Mersey Docks and Harbour Board the Board carefully maintained the posts free from barnacles and repainted the scale which was in feet and inches up to 32 feet the posts being fixed marks were also used for surveying purposes. At one time there were three posts and three are marked on the Admiralty Chart of 1980. For archive purposes it would be nice to have a photograph of these three posts.
Tide Measurement.
Predicted tides are published as Tide tables the tide heights predicted in the Tables are related to Chart Datum which is a local measure of the lowest level to which the tides ever fall in open water under astronomical influences. Admiralty charts quote sea depths and shore levels relative to Chart Datum whereas all Ordnance Survey maps relate levels to Ordnance Datum. Ordnance Datum is also known as “Newlyn” Datum because it is based on the average sea level at Newlyn, Cornwall because world sea levels are slowly rising and because land masses also move vertically over long period of time if is sometimes necessary to review and slightly revise any Datum. In Liverpool Bay, Chart Datum is 4.93 metres (16ft 2ins) below Ordnance Datum The highest astronomically generated tides rise 10.3 metre (33ft 9.5 ins) above Chart Datum. However any tide will be affected by the weather and tidal predictions must always be treated with caution.
Low barometric pressure or strong on-shore winds can advance the time of high Water, increase the rate at which the tide rises and add up to 2 metre (6ft 6ins) to the height of the tide This effect is known as a Storm Surge and as an example the Storm Surges of 26th to 25th February 1990 caused severe tidal flooding around the North West and North Wales coast, with disastrous consequence at Towyn
Tides are recorded nationally and internationally by the Proudman Oceanographic Laboratory, now in Liverpool but previously at the Bidston where the Observatory has long been associated with the science of tidal prediction The national tide gauge net work consist of 37 stations around the coast of England, Scotland and Wales. The tide gauges originally used were all float-operated with movements of the float in a stilling well transferred onto a clock-work driven paper chart recording drum. Most of the new instruments in the recording network are pneumatic device operating on the bubbler principle. This measure the pressure needed to force a bubble of air out of an underwater reservoir. The units are simple and robust and can operate automatically, sending data by telephone back to the central receiving and data processing station.
Tide level have been recorded at Liverpool since 1854. At various times gauges have been sited at Georges Dock, Prince Pier and Gladstone Dock , There is also a tide gauge at Hilbre Island The data even when averaged is so variable that it is very hard to discern any local trend in mean sea level. The evidence suggests that the rate of annual rise is in the range of 1 to 3 millimetres per year which approximately matches the trend in global sea level rise. It has not yet been possible to spot any increased rate of sea level rise due to the much publicised “Greenhouse Effect”